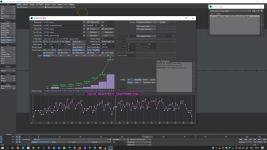
Legato Chorus

vncnt

New member
Since it's almost Christmas, here's the announcement of a little gift that I'll be posting here soon: Legato Chorus.

It calculates the Arbitrary Range for best Quality Control during the render process of an entire animation, by rendering in a pattern rather than a linear fashion.
The advantage is that you can abort the rendering process after a minimum of CPU time as soon as you notice irregularities that you could not find in an earlier phase of your work.
The pattern attempts to cover the render range as fast as possible, to minimize loss of valuable time in case of problems.

Under normal use, the Render Range is split into eight stages.

stage 1: contains the First Frame, and optionally the End Frame, Middle Frame, and the First 2^7 Pass (step size +128)​
stage 2: contains the Second 2^7 Pass (step size +128, starting at frame 64)​
stage 3 .. 8: contain the next passes​
In case End Frame, Middle Frame, and First 2^7 Pass are turned off for stage 1, they will be processed in one of the other stages.
Whether they are useful depends on your animation.

The results per stage are updated in the graph, based on the selected options and the Render Range in the Render Properties panel (use Range Type = 'Single' for this).

How well your Media Player or NLE-/VFX software is able to process missing frames (by holding the last available frame), may determine if this plugin works for you.
A second Layout window would also be fine.
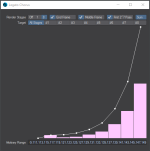
LegatoChorus_preview.png

To use this render pattern, select option 'All Stages' and double click on the data field 'Arbitrary Range'.
Then Copy this value to the Frames data field in Render Properties panel, after you've changed the Range Type to 'Arbitrary'.

Instead of using the entire Arbitrary Range, you can select a specific stage for separate processing.
There is also a Single Stage mode. It can apply the optional End Frame and Middle Frame.

Btw, I named the plugin after the album Chorus by (my synth hero) Vince Clarke (+ Andy Bell).

I need some additional time to save/load its settings. After that it should be ready for publishing.

Note that the plugin output is meant for F10 rendering.
If all is well, I'll add its functionality to Legato Send To NRC, that already supports network rendering with: single frame, sequence, single frame segments, sequence frame segments, and Fusion post processing.
 
MERRY CHRISTMAS and a HAPPY NEW YEAR

Here is my present.
It should work fine with LW2015 .. LW2020.

This is a first version of my plugin LEGATO CHORUS.
It generates a pattern of frame numbers that covers the render range as quickly as possible.

This can be useful if you want to monitor the output quality during final rendering and want to reduce the risk of detecting an error at almost the end of the render process. Or maybe you (also) want to spread the rendered frames across the entire shot, to get the best preview in your NLE or VFX software. Fusion and LightWave will handle these type of images sequences (with missing frames) just fine.

LegatoChorus_panel.png

TO USE LEGATO CHORUS


1. Install the plugin.
2. Search its name in the list of Master Plugins, double click to open its interface.
3. The 'Arbitrary Range' contains the current render range, as
defined in the Render Properties panel.
You may update the start and/or end frame.
Then click any button in the Legato Chorus interface to force an update.
4. Select '8' as the number of Render Stages.
Resize the dialog interface to view the graph.
The graph contains the number of frames per Stage.
Click button 'Sum' to show a line graph to show the sum of all stages.
5. Click button '#1' as the Target.
Note the details in the Status Bar in the Layout interface.
The Arbitrary Range contains the start frame number and the optional frame numbers.
Deselect 'End Frame', 'Middle Frame', and/or 'First 2^7 Pass' to remove
these frames from the Arbitrary Range of Stage #1.
6. Click button 'All Stages' as the Target.
Double click data field Arbitrary Range and press keyboard Ctrl+C to copy.
7. Change the Range Type in the Render Properties panel to Arbitrary.
Paste the copied text into data field Frames.
You are ready to start the F10 render.

Settings of buttons and panel visibility will be saved with your scene file, and restored at loading.

Have fun!
V.
 

Attachments

  • Legato_Chorus.zip
    38.1 KB · Views: 147
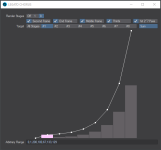
Couldn't resist to add 2 buttons.

Second Frame
Promotes the 2nd frame from stage #7 to stage #1.
Useful for applications, like Vegas Pro, that need a second frame to identify the selected start frame image file as an 'image sequence'.

Thirds
Promotes the frame at 1/3 and at 2/3 of the render range to stage #1.
They will be taken away from their original stages (that depends on the size of the render range).

Chorus2.png

To test the new (and older) buttons, choose '1' for Render Stages, or choose '2', for instance in combination with Target '#1'.
Then toggle the five buttons and watch their impact on the graph and Arbitrary Range.

Note that percentages are absolute (0 .. 100%) when 'Sum' is active.
When 'Sum' is not active, the graph is auto-resized to the highest value.

Also, Legato Chorus has no clue about estimated rendertimes per frame.
That's why each frame has the same weight in the 'Sum' line graph.

My other plugin Legato Send To NRC is able to store historical statistics, with or without (up to extreme) resizing.
So stay tuned for that update (maybe Feb).
 

Attachments

  • Legato_Chorus.zip
    34.2 KB · Views: 148
A first impression of Legato Chorus during development.
Lot's of empty space to change the position of older UI elements.
I've added the Legato Chorus code to the existing Legato Send To NRC code.

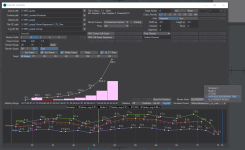
- The Chorus graph and the frame range selection area are both resized when resizing the dialog.
- Added the % text to the graph.
- Fixed a bug that caused the Middle Frame and both Thirds frames to be incorrect when startframe was not 0.
- When updating the Render Range in the Render Properties panel, both the SendToNRC render range and Chorus graph update live.
- A first implementation of Log QC. Using the NRC log file as a source for render performance for each rendernode/frame/scene. In this image I'm using test data, but it can already be stored as a Prediction in one of the Render Profiles. The Log file contains accurate (1/10 s) rendertime - a better method compared to the File QC when dealing with multiple rendernodes. Also need to change the NRC installation to a Service (win) to bypass the limit on the number of messages in the Log file, and to log to a default file (without manual saving).
- I've prepared the plugin data format for later expansion of the number of Render Profiles.

Chorus3.png

Only a few issues to solve:

- Add a master switch to limit the number of buttons, and streamline the UI.
- Add a step in the process to edit (a copy of) the source scene file, in order to change the Arbitrary Range in the scene files as referenced in the NRC job files. There is no LScript command for this. Glad that the plugin already uses copied scenes to facilitate different NRC jobs.
- Add more noise related render parameters to the render profiles. Unfortunately GI rays and Light samples cannot be controlled by LScript, and therefore not via the Render Profiles in this plugin. Luckily parameters like ReflectionSamples, RefractionSamples, SubsurfaceScatteringSamples can be controlled from the plugin.
- F9 testing per frame is not promoted very well. The new interface should include a better guide to obtain relevant render profiles for predictions.
- The Sum graph must be influenced by the rendertime/frame for better prediction while using Render Stages.
- A method to store performance factors per rendernode for better predictions, job optimization, and energy saving.
 
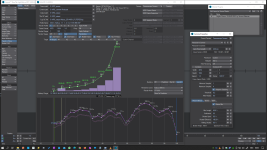
A first Log graph!
This is from a simple rotating box surrounded by 7 instances, directed by NRC on pc 'STUDIO', rendered on that same desktop 'STUDIO', identical desktop 'Screamer-1', and Surface Pro 9 tablet 'Studio-V'.

The Chorus code already recognizes unique rendernode names and unique scene file names, and presents each rendernode in its own line graph and statistics text.
Need to add code to handle more than 3 render nodes, and maybe filtering on specific available nodes and scenes.
It would be nice if the graph could be updated 'live' after each update of the Log file.

Cinebench already warned me that the Surface Pro 9 was a factor 1.85x faster than the 10 years old desktops (i7-3770K, 3.50 GHz, 32 GB, 4x cores, 8x logical processors) but this rubs it in.

The network overhead reduces the efficiency because of the 3D scene/object transfer from the NRC desktop, the relatively short rendertimes, and transfer of multiple layers of output images to the NRC desktop.

Also interesting to see that NRC desktop 'STUDIO' is indeed the slowest of them all, even slower than 'Screamer-1' with equal specs.

Chorus4.png
 
Together with the 3-JAN-2023 version of Legato CHORUS I've managed to create a LW2020 demo scene.
If you are using an older version of LW, you need to create a scene yourself.
Follow the instructions in the readme.txt
I've included a nrc.log file to get you started. Try your own file.

Some known limitations worth mentioning:
do not use spaces in render node names, interpolated dots are not always visible for some stupid reason, only the first 10 nodes have a different color, text, rendering time > 60 s, etc.

This version of Legato CHORUS can read the NRC log file, recognize individual render nodes and render scenes, calculate the average rendering time, and transfer performance data to Render Profile 1 .. 5. Average rendering time is calculated by using the interpolated data of each render node. I think this give you the best representation of the average performance/frame of the online render nodes in your entire system. This performance profile will be further explored in next versions, for example to improve predictions.

In the graph area you can Zoom (drag RMB), Pan (drag MMB), Reset zoom to render range (double-click RMB), Select frame range (drag LMB), and change Current Frame (click LMB).

Chorus5.png
 

Attachments

  • Plugin+Demo.zip
    251.4 KB · Views: 151
Started to work on the next version.
Latest modifications:
  • solved a bug in the 'Arbitrary Range' when '2nd Frame' was active and 'Render Stages' was set to '8';
  • increased the number of Render Profiles to eight;
  • renamed both Apply buttons into 'Apply Profile' and 'Apply Settings';
  • renamed 'Zoom' to 'Focus'; zooming is already supported by: 2x RMB-click and keyboard 'a' to zoom into render range, and keyboard 'g' to zoom into selected frame range, zoom with RMB-drag, pan with MMB-drag;
  • grouped the 'Proxy' pulldown listbox with the [project] Frame Format | Render Range;
  • moved pulldown listboxes 'Rendered Scene' to the top
  • grouped 'Store As Prediction' with the filter settings above
  • the 'Proxy' setting is still being considered when sending a frame, a frame sequence, or a frame selection to the NRC but now the 'Apply Settings' button also considers its settings; the frame aspect ratio and the pixel aspect ratio are used to change the pixel aspect ratio of the Proxy settings to compensate for changes in frame aspect ratio; note that available proxy settings are square n^x or rectangular n^x only;
  • added button 'Frame Test' because the F9 measurement needed the plugin dialog to be selected (and wasn't very obviously available as a feature);
  • added a green Render time line in the graph, that displays the estimated render time based on the measurements (derived from 'File QC' or 'Log QC' via button 'Store As Prediction' or 'Frame Test' of the current frame;
  • render time is presented in days, hours, minutes, seconds or just seconds when below 1 minute;
  • differences in frame size as stored in the Render Profile is being translated to the [project] Frame Format settings by ratio of its area during the calculation of the render time as displayed in green;
Open issues:
  • [edit: READY] RT calculation of missing frames that depend on interpolation/extrapolation;
  • [edit: READY] Implemented RT calculation for 'Render Stage' = 'Off' and partly '1', and all modes still need to be tested in extreme situations;
  • [edit: READY] RT calculation for 'Render Stage' ='8' needs to be implemented;
  • There is no mechanism that prevents you to measure render time (in the 'Prediction' graph below) with mixed frame sizes;
  • I need to evaluate how accurate this simple method behaves; file transfer, scene loading, AA, etc may have their own influence when switching to higher resolutions; the goal is to predict final render time of high resolution render output, based on render time of small render output;
  • Interface improvements for NRC Full Frame and NRC Segment rendering;

Legato_next.png
 
Last edited:
Making progress.
After testing with four render nodes, with the Surface Pro 9 render node extremely lagging behind (I suspect it has something to do with the wifi connection, or the fact it's running Win11 on a tablet, or both, or other reason), I needed to filter my test log file to remove it. At this moment, the graph isn't prepared for extreme differences like these.
The test file made it clear that the design of my average calculation/display code needed a redesign because it couldn't handle the scene filter.
Below you can see the new average render time calculation (and 'Store As Prediction') method.

I've been testing with full range (100 frames) render jobs in multiple formats: 25%, 50%, 100%, 200%, and 400%.
Kubus_400.lws refers to 400%, a 3072x1024 px camera. Kubus_25.lws refers to 25%, a 192x64 px camera.
I'll use the results for some further testing.

The original Chorus graph has been enhanced with a green 'Render time' line.
In all three possible positions of 'Render Stages' (Off, 1, or 8) it looks up the render time of a frame and summed at each render stage.

I've stored the render time profile of render node 'STUDIO' to 'Render Profile' #1.
Note that below the selected 'Render Profile' #1 in this case is based on the same resolution as the project frame format.
If it wasn't, the render time would have been automatically adjusted pro rato.

Missing test frames are interpolated/extrapolated.
To get the estimated render time of all frames in full resolution for your entire renderfarm, you should use the average value.

Low-resolution test frames (+/- 6.25% width and 6,25% height) will result in a course prediction.
Medium-resolution (+/- 25% width and 25% height) will result in a more refined render time profile.
It would be interesting to see how render time profiles of different resolutions can be combined to improve the quality of a prediction with a minimum amount of test frames.

For now I need to run some more tests, and check if something obvious is missing before releasing the next version.
Stay tuned!

LegatoChorus_23mar23.png
 
Thanks Tim, and the good news is that my latest prediction implementation is not bad at all.
Not a final version yet but it's coming closer.

Let me explain how it works today (April 3, 2023).

I've added a 9th Render Profile: the 'Project' Render Profile.
Data fields for Frame Format (width, height, aspect-ratio) are now linked to each Render Profile.
In the Chorus graph, the green line represents the summed Render Time per Stage. It's using the real render data from the Log. I need to run more tests to check its robustness.
The Focus button now also removes the bar graph, to speed up redraw.
The AA settings, Shadow, Motion Blur / Particle Blur, Reflection, Refraction, DOF settings are now linked to the current Render Profile.
Very important for an acceptable prediction result is the new 'Reference Slot', default set to 'Project Profile', the Scale Factor (contains the ratio between proxy render area and target render area), and the secret ingredient is the Error Compensation to compensate for fixed overhead, frame size related overhead (for example: output file size), and easier AA (less details) when rendering low resolution images.

The Error Compensation needs one or more rendered frames in the target resolution/quality (as defined by Reference Slot) and is automatically calculated.
If the render time profile fluctuates a lot, you need more measurements for more precise results.
Usually the proxy frames are easy to render and so they can provide detailed fluctuation data.
The process is flexible: both proxy frames and target frames are interpolated to make a good estimate of the total amount of rendertime that your NRC farm needs.
Use real measurements of all render nodes, not the averaged values, to calculate the estimated render time of your target render resolution.
Your proxy files need the same settings for motion blur, shadow, reflection, refraction, depth of field, AA settings, and all other settings that influence render quality or render details. Otherwise it will be very difficult to get a good estimate.

Below you can see the render time of the 'rotating cubes' test scene, originally fully rendered between 25% and 400% frame size.

The 400% frame size (3072x1024 px) render time data (measurements are read from the NRC log file in 'Log QC' mode) is stored in Render Profile '8' and Render Profile 'Project'. Note that I've cleared some data in the 'Project' Render Profile to simulate a situation where only a few frames have been rendered in final render quality, full resolution.
Render Profile '2' holds some measurements in 25% resolution (192x64 px)

LegatoChorus_prediction.png

Note that frame 12, 42, and 72 were rendered by the surface pro 9 tablet but were too extreme to include them.
These frame render times have been interpolated automatically because I've removed the measurements from the Log file.

The reason to feel happy is that the estimation seems consistent.
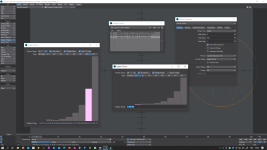
LEFT DIALOG: When selecting Render Profile '8' with Reference Slot 'Project Profile', the estimated render time is 02:34:23.
RIGHT DIALOG: When selecting Render Profile '2' with Reference Slot 'Project Profile', the estimated render time is 02:34:46.

With both Proxy data and Target data being interpolated (at different frames) that result is terrifyingly close.
This is a great result.

Also, changing the Render Stages setting between 'Off' (linear), '1' (priority frames + linear), '8' (priority frames + exponential), results in a consistent total render time.
Time to clean-up some things, make shure the Render Time graph is perfect, and make a video to explain the standard procedure.

Stay tuned!
 
Some issues have been solved now, for example:
- Frame selection has been fixed. Drag the middle section to modify the entire selection, or the left/right section to extend/shorten.

New features:
- I had to add another "Render Nodes" field per Render Profile. It's needed to calculate the correct render time because in case of n render nodes there are n frames processed at the same moment. The predicted 02:28:33 in the example below should be 50 minutes instead, 3x less. The number of processed Frames per Render Stage that cannot be divided in n nodes must be compensated.
- Added a Node Performance listbox with some statistical data. You can select multiple nodes to highlight them in the graph.

Tomorrow I'll try to finish the next release.
Time to sleep.

LegatoChorus_prediction2.png
 
I figured out that simply dividing the total amount of render time per stage by the number of render nodes isn't accurate enough to my taste. It's okay for the total render time but less accurate for everything inbetween.
Especially when there are differences in performance between nodes.
Also, some stages contain less frames than the number of nodes. That would make the estimated render time for that stage very inaccurate. Not a big deal, but I like to finish this with minimal flaws.

Main issue here:
A different order of frames actually changes the render node that handles the frame, and the assignment of each frame after that.

To fix this:
I now added the render node # to each samples.
Also, the node performance data is now copied to each render profile (and save/retrieved to/from the LWS file), and can be used in Prediction mode:
it enables you to highlight the dots of each (multi-)selected render node.

To do:
1] This data makes it possible to interpolate RT to a frame that wasn't processed by that node itself, dictated by a simulation of the dispatch function behaviour of the NRC controller. Assuming each node is started in the same order as they appeared in the log file, and therefore appearing in that same order in the render node list.
2] Each successive frame is then assigned to the render node with the lowest accumulated render time.
3] After all frames are assigned, each stage must receive a total render time in groups of n (n equal to the number of nodes).
 
Last edited:
I think it's now ready for a next release.
Here is the current 'final' interface:

LegatoChorus_prediction3.png

The Node Performance list is now also functional in 'Prediction' mode.
If you select one or more nodes, their samples are highlighted, the rest becomes dim.

The number of detected render nodes is available in 'Render Nodes', for each Render Profile separately.
It can be manually adjusted.

From now on, when the order of rendered frames (in the Arbitrary Range field) changes, render time is calculated from the new estimated render node instead of the measured render node for that frame.

Added a new button to reserve space for a new option, to choose between the current 'Average' method and a future 'Elastic' method.
The code still needs to be written but it may improve predictions in situations with only a few 'Reference Slot' samples (usually in the final resolution, or 'Project' render profile).

I'll prepare a ZIP file tomorrow, and hopefully a short demo video.
 
Back
Top